Communication Equipment
| Unit | 2023 | 2024 | 2025 | |
|---|---|---|---|---|
| CO2 emissions*3 | ||||
| Scope1 | tCO2 | 7,524 | 6,198 | 5,990 |
| Scope2 | tCO2 | 25,648 | 21,436 | 21,640 |
| Scope1+Scope2 | tCO2 | 33,171 | 27,634 | 27,630 |
| Percent change of Scope 1 + Scope 2 | % | 111 | 92 | 92 |
| Percent change of emission intensity Scope 1 + Scope 2*4 | % | 73 | 62 | 65 |
| Waste emissions | ||||
| Total emissions | t | 7,127 | 6,256 | 6,143 |
| Percent change of emission intensity*4 | % | 76 | 69 | 71 |
| Water usage | ||||
| Total emissions | m³ | 207,964 | 186,678 | 186,690 |
| Percent change of emission intensity*4 | % | 83 | 75 | 76 |
| VOC emissions*5 | ||||
| Total emissions | kg | 59,771 | 48,950 | 44,548 |
| Percent change of emission intensity*4 | % | 120 | 176 | 184 |
*1: Scope: Head Office, Inuyama Plant, Ise Plant, Kaga Factory, Muratec Mechatronics Co., Ltd. (Shiga and Oita)
*2: Increase/decrease ratio for each datum is referenced as a percentage against March FY2018 as the base.
*3: For CO₂ emissions, from March FY2024 onward, emission factors of each electric power company are applied.(Until March FY2023,emission factors based on substitute values from March FY2018 were used as the base.)
*4: Emission intensity: CO₂ emissions and waste emissions are based on production values (as per unit of total man-hours for the Head Office only), water usage is based on total production costs, and VOC emissions are based on production amounts.
*5: Scope for the VOC emissions: Inuyama Plant, Kaga Factory, and Muratec Mechatronics Co., Ltd. (Shiga Plant)
| Unit | 2023 | 2024 | 2025 | |
|---|---|---|---|---|
| Full-time employees | People | 3,818 | 3,670 | 3,508 |
| Male | 3,034 | 2,908 | 2,754 | |
| Female | 784 | 762 | 754 | |
| Temporary & contract employees | People | 259 | 285 | 326 |
| Male | 235 | 257 | 294 | |
| Female | 24 | 28 | 32 | |
| Part-time employees | People | 247 | 325 | 299 |
| Male | 150 | 206 | 200 | |
| Female | 97 | 119 | 99 | |
| Average age | Years | 40.7 | 40.8 | 41.8 |
| Male | 41.6 | 41.6 | 42.6 | |
| Female | 37.0 | 37.2 | 38.5 | |
| Percentage of employees covered by collective bargaining agreements* | % | 53.1 | 52.5 | 56.1 |
※*Method for calculating the percentage of employees covered by collective bargaining agreements: (Number of union members as of March 31, 2025) / (Total number of employees as of March 31, 2025)
| Age distribution ratio | 29 and under | 30–39 | 40–49 | 50–59 | 60–69 |
|---|---|---|---|---|---|
| No. of people | 917 | 918 | 796 | 885 | 379 |
*Data calculation targets for “Workforce Organization,” “Employee Retention,” “Employment & Wages,” and “Work-Life Balance” are for Murata Machinery, Ltd. on a standalone basis.
| Unit | 2023 | 2024 | 2025 | |
|---|---|---|---|---|
| Average length of service | Year | 15.4 | 15.5 | 15.5 |
| Male | 16.0 | 16.1 | 16.1 | |
| Female | 12.7 | 12.8 | 13.0 | |
| Retention rate after three years of employment for new graduates | % | 91.5 | 91.5 | 88.2 |
| Male | 91.8 | 93.8 | 90.6 | |
| Female | 90.5 | 81.8 | 80.0 | |
| Employee attrition rate due to personal reasons* | % | 2.5 | 2.2 | 3.1 |
| Male | 2.0 | 2.1 | 2.8 | |
| Female | 4.5 | 2.8 | 4.2 |
*Method for calculating voluntary turnover rate: (Total number of employees who left between April 1, 2024 and March 31, 2025) / (Total number of employees as of April 1, 2025)
| Unit | 2023 | 2024 | 2025 | |
|---|---|---|---|---|
| Number of new graduate hires | People | 153 | 134 | 105 |
| Male | 113 | 109 | 68 | |
| Female | 40 | 25 | 37 | |
| Number of mid-career hires | People | 148 | 103 | 79 |
| Male | 114 | 79 | 61 | |
| Female | 34 | 24 | 18 | |
| Number of persons with disabilities hired | People | 96 | 103 | 103 |
| Employment rate for persons with disabilities | % | 2.36 | 2.39 | 2.34 |
| Number of female titled employees*1 | People | 105 | 129 | 118 |
| Number of male titled employees | People | 1,575 | 1,581 | 1,445 |
| Proportion of female among all titled employees*1 | % | 6.25 | 7.05 | 7.55 |
| Percentage of female managers | % | 3.29 | 4.11 | 4.41 |
| Number of foreign employees*2 | People | 188 | 252 | 218 |
| Difference in wages for men/women*3 | % | |||
| All employees | 62.7 | 65.1 | 68.3 | |
| Full-time employees | 65.4 | 67.3 | 69.7 | |
| Part-time and temporary employees | 50.1 | 53.3 | 55.9 |
*1: Titled employees: assistant managers or higher positions
*2: Number of non-Japanese employees, including technical interns
*3: Women’s wages as a percentage of men’s wages
| Unit | 2023 | 2024 | 2025 | |
|---|---|---|---|---|
| Yearly average of annual leave days taken | Days | 11.6 | 12.0 | 12.2 |
| Percentage of employees taking annual leave | % | 63.3 | 66.0 | 71.1 |
| Number of employees taking annual leave | People | 75 | 116 | 83 |
| Rate of childcare leave taken*1 | % | |||
| Male | 53.1 | 78.6 | 68.3 | |
| Female | 78.1 | 134.6 | 96.4 | |
| Employees taking childcare leave | Total people | 75 | 116 | 83 |
| Male | People | 50 | 81 | 56 |
| Female | People | 25 | 35 | 27 |
| Employees entitled to take childcare leave | Total people | 128 | 129 | 110 |
| Male | people | 96 | 103 | 82 |
| Female | People | 32 | 26 | 28 |
| Percentage of employees returning to work after childcare leave | % | 100 | 100 | 100 |
| Male | 100 | 100 | 100 | |
| Female | 100 | 100 | 100 | |
| Number of employees working reduced hours for childcare*2 | People | 98 | 104 | 110 |
| Male | 2 | 2 | 3 | |
| Female | 96 | 102 | 107 | |
| Number of employees taking family care leave*3 | People | 0 | 3 | 4 |
| Male | 0 | 1 | 4 | |
| Female | 0 | 2 | 0 | |
| Number of employees working reduced hours for family nursing care*4 | People | 1 | 2 | 3 |
| Male | 0 | 0 | 0 | |
| Female | 1 | 2 | 3 |
*1: Calculated using the method based on Act on Childcare Leave,Caregiver Leave, and Other Measures for the Welfare of Workers.Number of employees taking first childcare leave in FY2024 / Number of employees who had a baby in FY2024 x 100 Figures may exceed 100% due to differences in the employee-counts used for the numerator and denominator values.
*2: Number of employees using the relevant reduced work-hour program as of March 31, 2025
*3: Full-time employees only
*4: Number of employees who started a leave period in the fiscal year
| 2021 | 2022 | 2023 | 2024 | 2025 | |
|---|---|---|---|---|---|
| Accidents with lost work time (1 day or more of lost work time) |
1 | 2 | 4 | 3 | 5 |
| Accident with no lost work time (less than 1 day of lost work time) |
13 | 14 | 15 | 12 | 10 |
Scope: Head Office, Inuyama Plant, Ise Plant, Kaga Factory,and Muratec Mechatronics Co., Ltd. (Shiga and Oita), including temporary employees but excluding employees of contractors
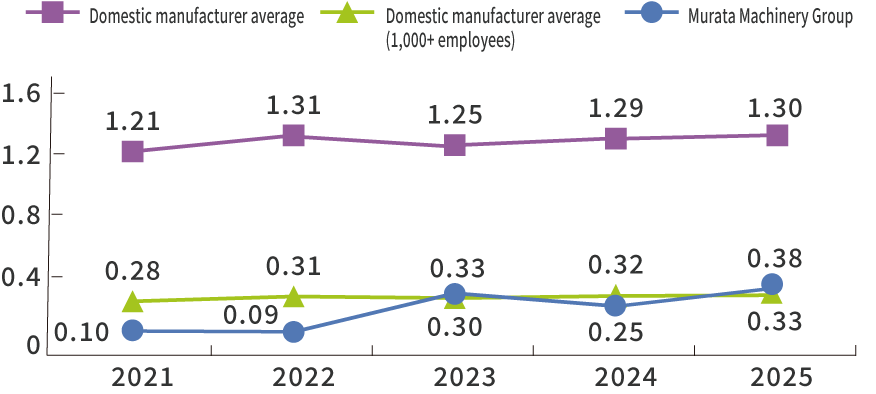
*1: Number of work-related fatalities and injuries per million total working hours, indicating the frequency of accidents
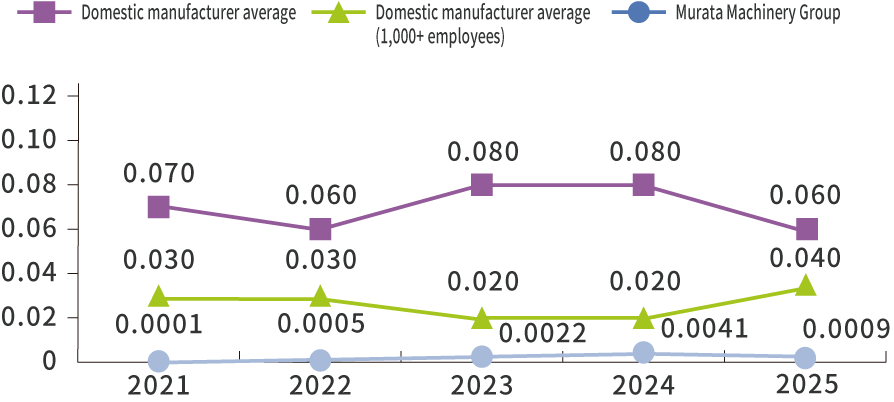
*2: Number of lost workdays per 1,000 total actual working hours, indicating the severity of accidents
*3: The domestic manufacturing industry average is cited from the Ministry of Health, Labour and Welfare’s Survey on Industrial Accident Trends.
| Area | Metrics | 2023 | 2024 | 2025 | Targets (by 2027) |
|---|---|---|---|---|---|
| Eating Habits | Percentage of employees with a BMI between 18.5 and 25 | 64.7% | 63.2% | 62.4% | 70% or more |
| Percentage of employees who skip breakfast 3 or more times a week | 22.9% | 22.5% | 23.8% | 15% or less | |
| Exercise | Percentage of employees who exercise 2 or more days a week | 22.3% | 22.8% | 25.0% | 25% or more |
| Percentage of employees who walk or engage in an equivalent physical activity for at least 1 hour daily | 38.3% | 38.4% | 44.8% | 40% or more | |
| Sleep | Percentage of employees who are well-rested from getting enough sleep | 64.6% | 63.6% | 63.2% | 70% or more |
| Smoking | Percentage of employees who smoke | 20.3% | 19.5% | 20.0% | 18% or less |
| Mental Health | Percentage of employees who underwent stress checks | 93.5% | 92.8% | 94.4% | 100% |
| Percentage of employees identified as high-stress individuals in stress checks | 12.1% | 12.0% | 11.5% | 10% or less | |
| Health Checkups | Percentage of employees who underwent regular health checkups | 100.0% | 100.0% | 100.0% | 100% |
| Percentage of employees with health concerns who submitted a medical examination report | 89.0% | 90.8% | 91.6% | 92% or more |
Scope: Murata Machinery, Ltd., Muratec Mechatronics Co., Ltd.,Muratec Frontier, Ltd., Murata Parts Sales Co., Ltd., Murata System Co., Ltd., Muratec C.C.S, Ltd., Murata Tool, Ltd., Techno Advance Co., Ltd., Murata Engineering Co., Ltd., Murata Kosan Co., Ltd., and Murata Machinery Health Insurance Association.
| 2023 | 2024 | 2025 | |
|---|---|---|---|
| Number of directors | 10 | 10 | 10 |
| Outside director | 0 | 0 | 0 |
| Female director | 0 | 0 | 0 |
| Number of auditors | 1 | 1 | 1 |
| 2023 | 2024 | 2025 | |
|---|---|---|---|
| Compliance Reporting Hotline | 5 | 7 | 15 |
| Whistleblower Hotline (Corporate Ethics 119) | 9 | 14 | 11 |
| Harassment Help Desk | 31 | 25 | 24 |